Financial Highlights
経営指標の推移

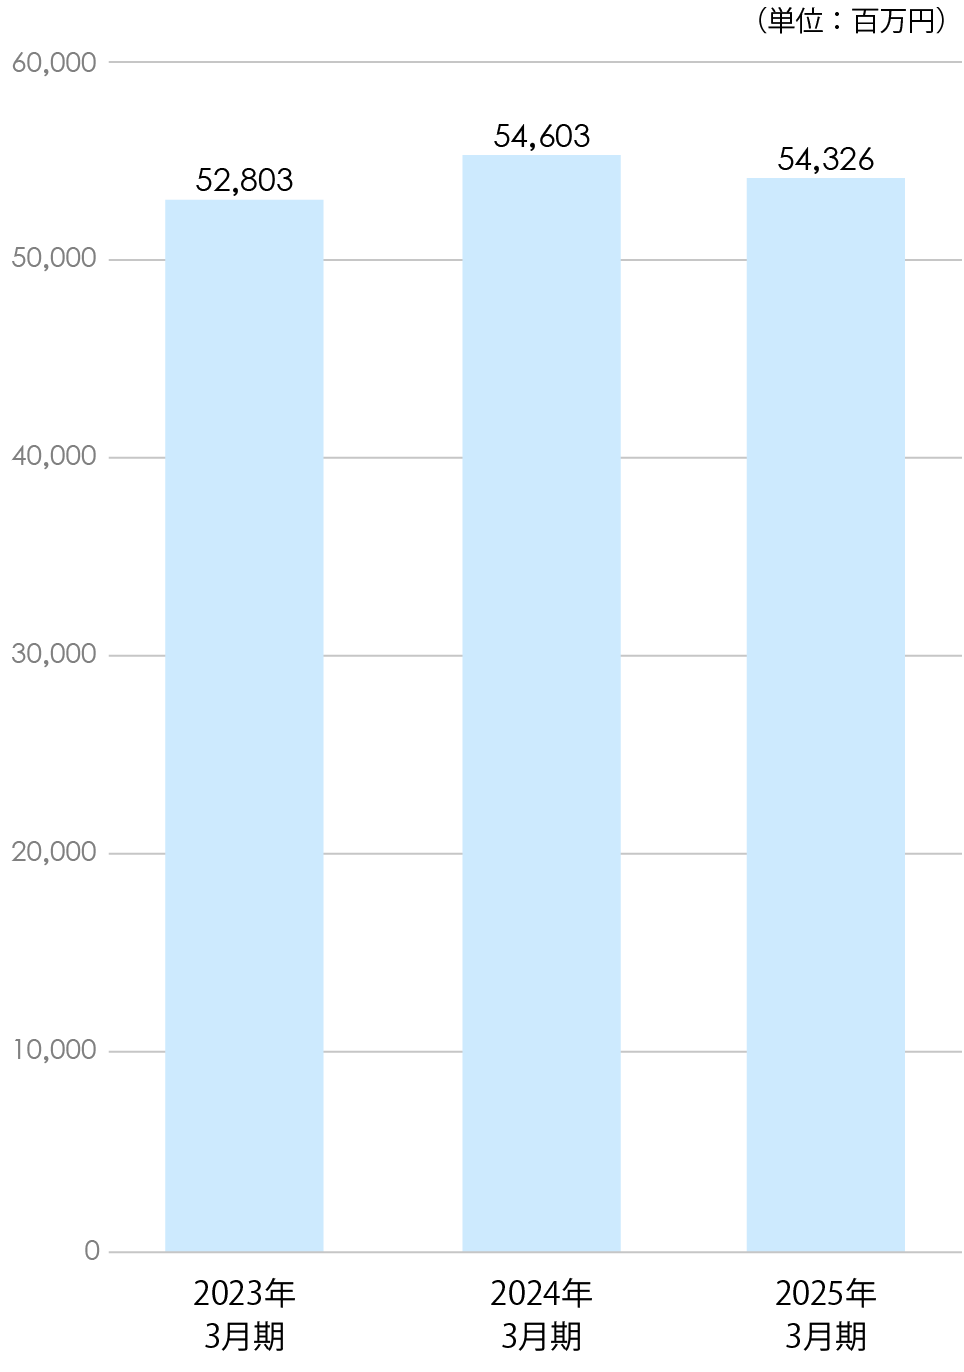
<連結>売上高
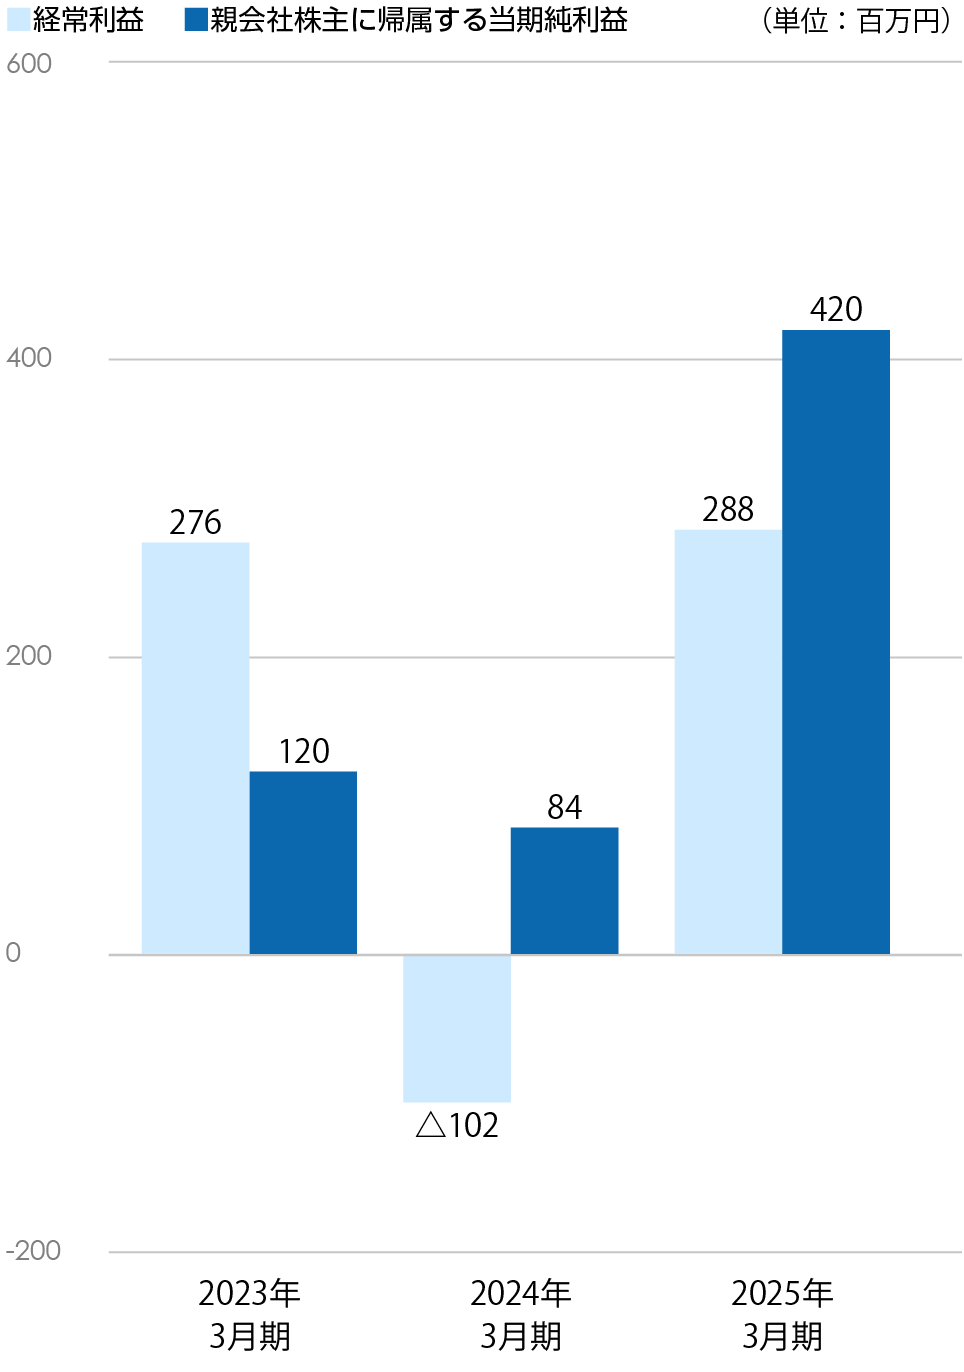
<連結> 経常利益・親会社株主に帰属する当期純利益
(注)2024年3月期より表示方法の変更を行っており、2023年3月期の売上高については当該変更を反映した組替え後の金額を記載しております。
経営指標の推移
| 2021/03 | 2022/03 | 2023/03 | 2024/03 | 2025/03 | |
|---|---|---|---|---|---|
| 売上高(百万円) | 57,358 | 53,747 | 52,803 | 54,603 | 54,326 |
| 経常利益又は経常損失(△)(百万円) | 1,870 | 1,056 | 276 | △102 | 288 |
| 親会社株主に帰属する当期純利益(百万円) | 1,279 | 613 | 120 | 84 | 420 |
| 総資産額(百万円) | 36,681 | 36,353 | 37,892 | 39,701 | 35,726 |
| 純資産額(百万円) | 26,808 | 26,367 | 26,345 | 26,693 | 26,415 |